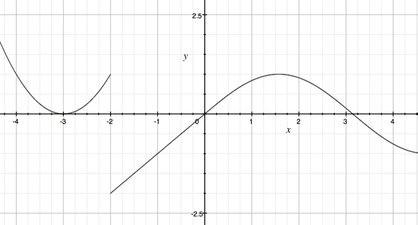
Piece-wise functions are functions that are made up of pieces of other functions. Later in math, you'll explore piecewise functions that look like this:
But for now, we'll stick to graphs that are made up of what you know how to graph: lines. Here's a graph of a piecewise function made up of two lines. One with a positive slope, (y=x), and one with a negative slope (y = -2x).
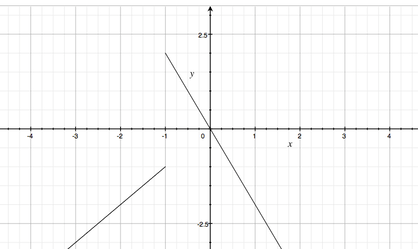
Do you notice how the graph is split at x = -1? To the left of x = -1, we only see the positively sloped line (x = 1). To the right of x = -1, we only see the negatively sloped graph (x = -2x).
In math we have a shortcut for saying this:
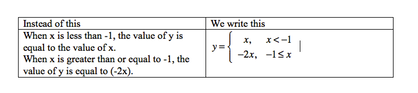
In a piecewise defined function we write the function defining each stem first (x and -2x), and then write the domain for that function, in other words, identify where that part of the graph is true.
When graphing piecewise functions, I've found it helpful to first identify where the graph is split (look at the domains of each function), and lightly sketch a vertical line to help mark where your division is, then graph each line--one to the left and one to the right.
Here's some additional resources to help you:
- Piecewise Defined Functions: Graphing
- Graphing a Piece-Wise Defined Function – Another
- Piecewise Functions (Randy Anderson)