You probably remember working with absolute value functions in middle school. They look something like this: |-4|, and tell us how far from zero a number is--in other words, take whatever is on the inside, and make it positive. This creates an interesting situation when a variable is used in the absolute value function. Let's take a look at y = |x|.
Ok, plug in some numbers around zero and get something interesting. For positive numbers, our line looks a lot like y = x
(0, 0), (1, 1), (2, 2)… and so on…
But when we plug in some negative numbers, something interesting happens: our negative x-values also produce positive y-values:
(-1, 1), (-2, 2), (-3, 3)… our negative half of the graph looks like a line with a negative slope. In fact, absolute value graphs look like this:
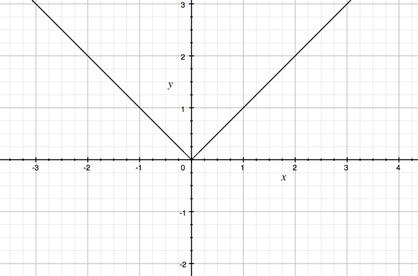
f(x) = |x| or f(x) = abs(x) both produce this graph, and it follows all the same transformations as other graphs we've studied.
Here's a more general form:
f(x) = a|x-h|+k, where a defines the steepness (and up or down version of the graph), h describes the x-coordinate of the vertex, and k describes the y-coordinate of the vertex.
Here are some extra resources to help you:
Graphing Absolute Value 1 (MathGal)
Graphing Absolute Value 2 (MathGal)
Graphing Absolute Value 3 (MathGal)
Graphing Absolute Value (BrightStorm)